Data Science Notes: Confidence Intervals
This year I resolved to start learning Data Science on my free time with the expectation of finding a way to use it in my every day work.
To help me in the process I have been writing some notes in the format of a private blog (which is a recurring tip that experts give to begginners). I’ll start publishing my private notes some other day, but today I wanted to write about the lastest item I have read about.
Disclaimer: The following are more my notes and less a tutorial.
Confidence Intervals
According to Harvey Motulsky, in Essential Biostatistics:
CIs express precission or margin of errors and so let you make a general conclusion from limited data. But this only works under the following assumptions:
- random sample / representative sample
- independent observations
- correctly tabulated data / free of bias
Meaning of 95% CI
If you calculate the 95% CI of a given observation, you would expect the real population to be encompassed by your CI 95% of the times. But there is no way for you to know whether the real population lies within your CI or not.
We do not say there is a 95% chance that the true population is in my CI, that’s flipping things around. The true population is fixed, and there is 95% chance that your CI contains it.
To make this more clear: let’s say you forgot your keys at the kitchen table (but you don’t remember where). If I ask you to guess where your keys are you may say something like “I am 95% sure that I forgot them at home”, which is different from “There is a 95% chance that the keys are at home”. Your keys are 100% at home, whether you know it or not.
A simulation
Harvey proposes the following exercise to understand better. I added some code to help.
Imagine you have a bowl with 100 balls, 25 of them are red and 75 are black. Pretend you are a researcher who doesn’t know the real distribution.
red_balls = ['red' for i in range(25)]
black_balls = ['black' for i in range(75)]
bowl = red_balls + black_balls
Next we mix the balls, choose one randomly and put it back again in the bowl. We repeat this process 15 times and calculate the 95% CI for this proportion:
import random
from statsmodels.stats.proportion import proportion_confint

def simulation():
    number_of_red_balls_observed = 0
    NUMBER_OF_TRIALS = 15
    CONFIDENCE_LEVEL = 0.95
    for i in range(NUMBER_OF_TRIALS):
        random.shuffle(bowl)
        ball = random.choice(bowl)
        if ball == 'red':
            number_of_red_balls_observed += 1
    ci_low, ci_up = proportion_confint(number_of_red_balls_observed, NUMBER_OF_TRIALS, alpha=1.0 - CONFIDENCE_LEVEL)
    observed_proportion = number_of_red_balls_observed/NUMBER_OF_TRIALS
    return (ci_low, ci_up, observed_proportion)
If we repeat this exercise 20 times we should see that:
- about half of the times the observed proportion is above the real population
- the other half of the times it would be lower
- 5% of the times the calculate CI will not encompass the real population
The following figure shows the 20 confidence intervals in the form of bars, with a line in the middle indicating the observed proportion. A horizontal line show the true proportion (25% of the balls are red).
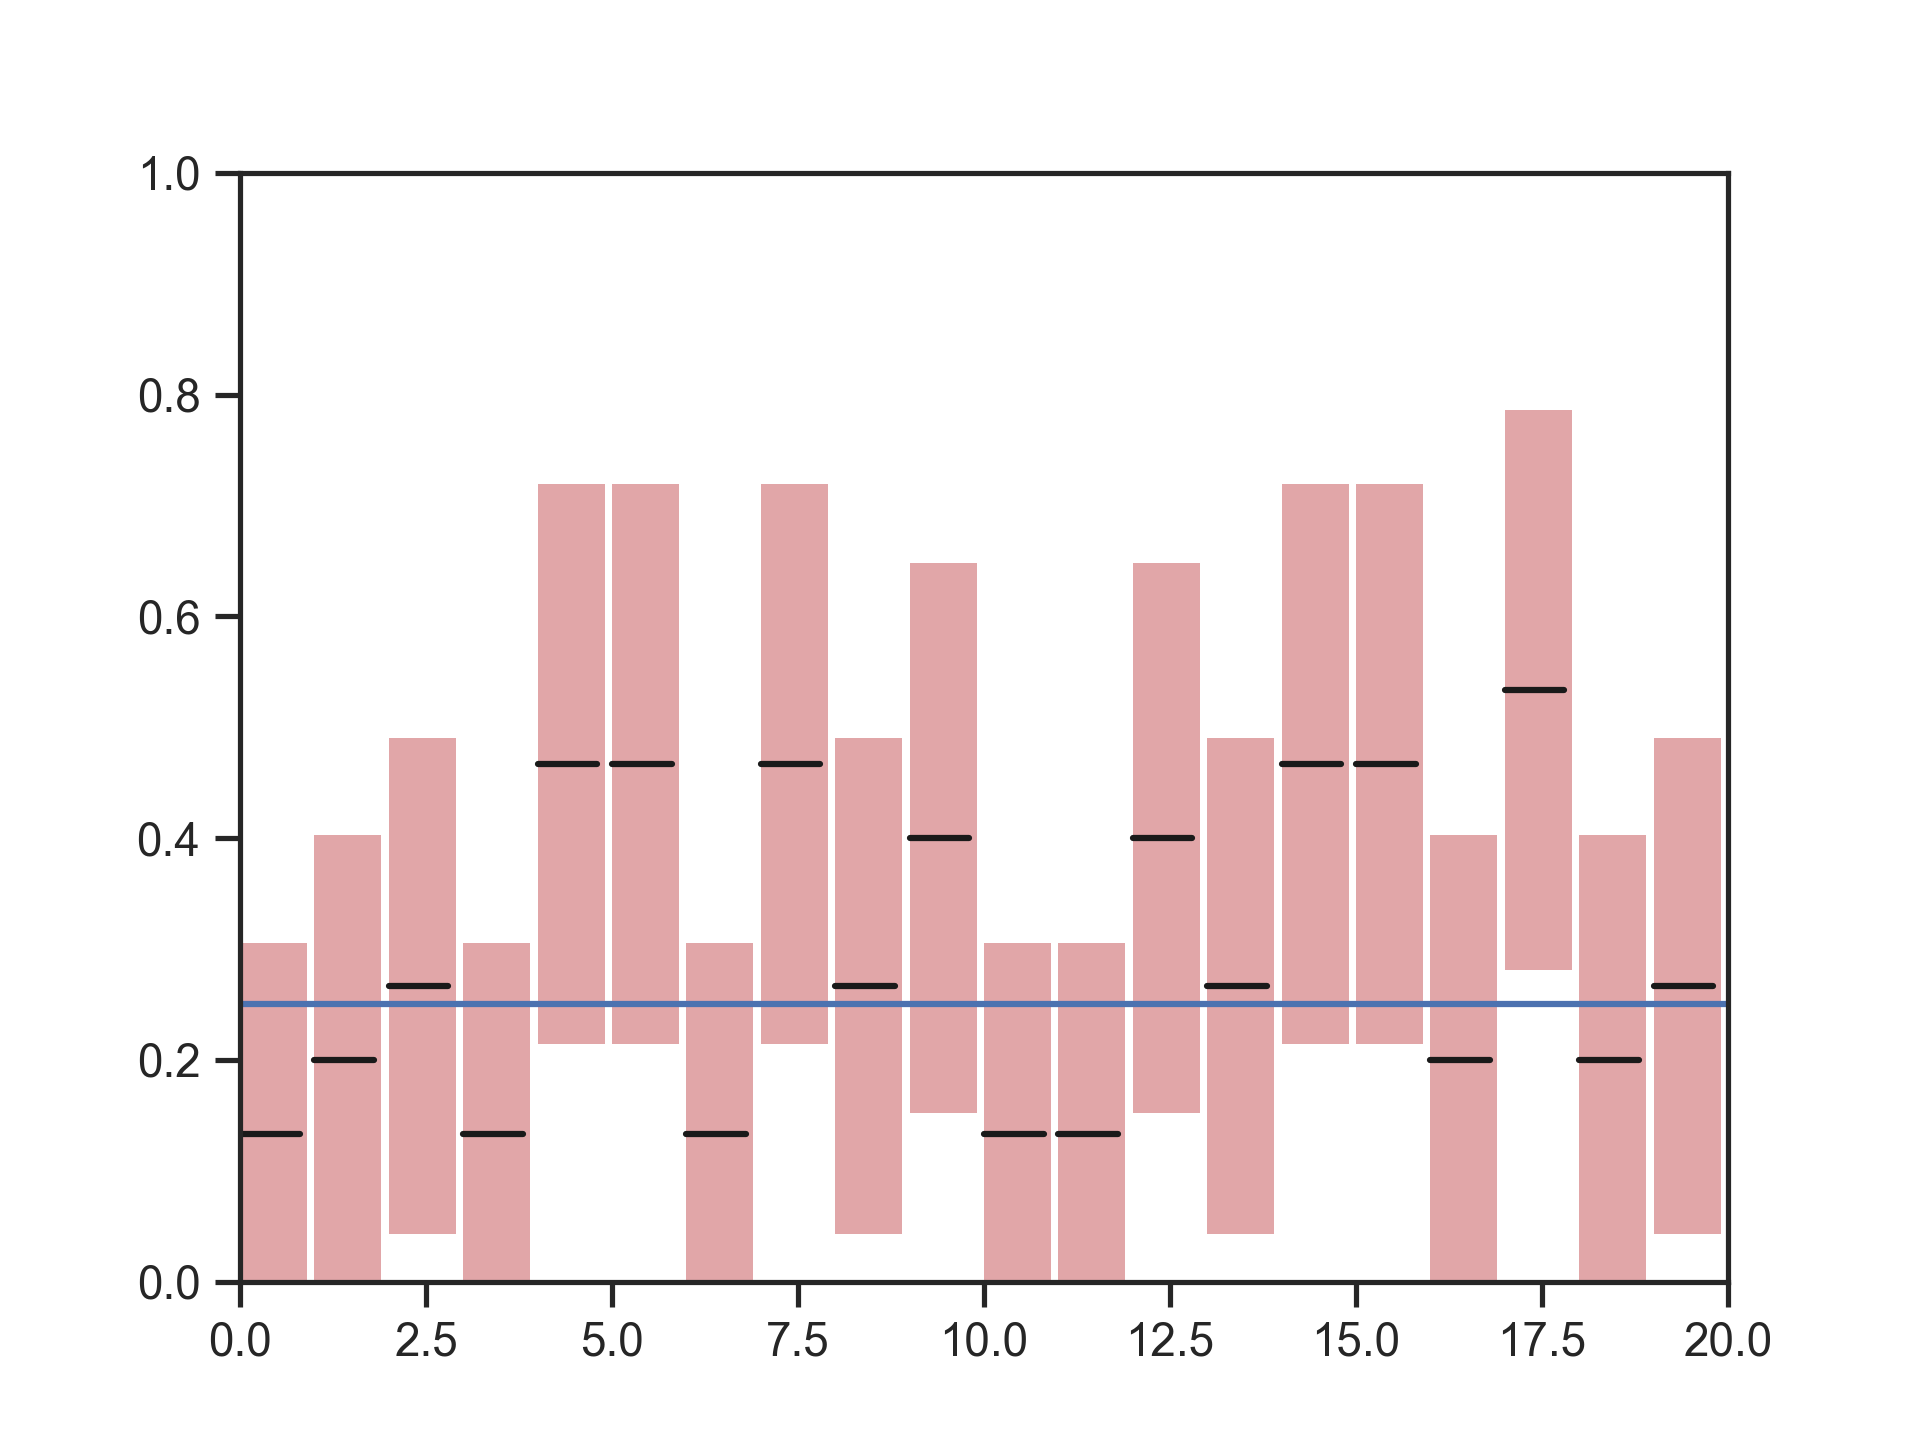 Figure 1: Confidence intervals of 20 samples from a binomial distribution B(15,0.25)
The code
You can find and run the full code at: github.com/ariera/essential-biostatistics